Harvard Study Finds 403 U.S. Hyperscale Data Centers Drew 82 Terawatts in a Year
A Harvard-led research team estimates that hyperscale data centers across the United States consumed roughly 82 TWh of electricity annually, accounting for 1.8% of national consumption and producing an estimated 25.7 million metric tons of carbon dioxide.
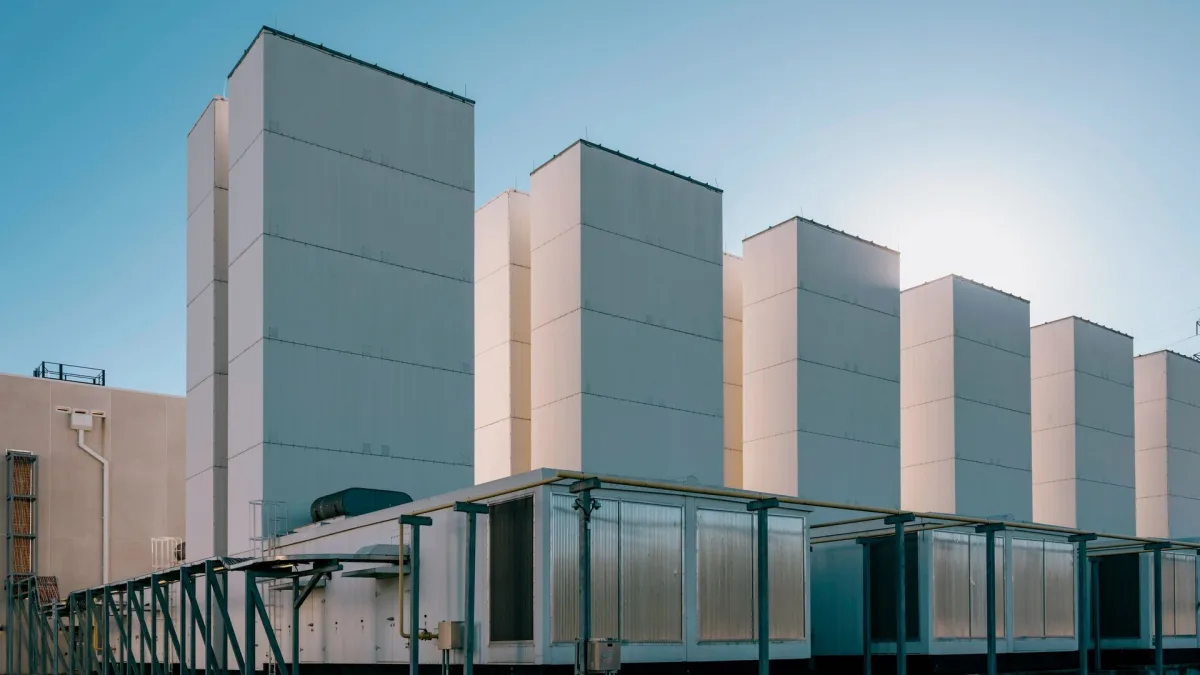
According to a Harvard-led study published in Nature Sustainability, 403 hyperscale U.S. data center facilities drew approximately 82 TWh of electricity over the course of a year, representing 1.8% of total U.S. electricity consumption. The research, reported by Wired, found that more than half of this power came from gas and coal sources. To put the figure in perspective, Michigan's entire state electricity sales reached 99 TWh in 2024. The facilities' energy consumption generated an estimated 25.7 million metric tons of CO2, roughly two to three times higher than a 2018 estimate.
The study defines hyperscale data centers as facilities operated by hyperscale cloud providers, content providers, or colocation operators serving such companies, with capacity measured in tens of megawatts. Researchers identified 675 candidate sites from data vendor Baxtel, confirming 403 through satellite imagery and building-footprint analysis. The confirmed facilities averaged 39.9 MW in capacity, with a median of 36 MW.
Because no official mechanism tracks actual grid consumption by data centers, the study employed estimation methods. Researchers multiplied each site's maximum capacity by the number of hours in a year and an estimate of operational intensity. For carbon emissions and energy source composition, each facility was assigned to one of 23 grid regions, with regional average fuel mixes sourced from the Environmental Protection Agency. These figures were then aggregated to reach totals. Such estimation approaches may weaken arguments used against data center expansion proposals.
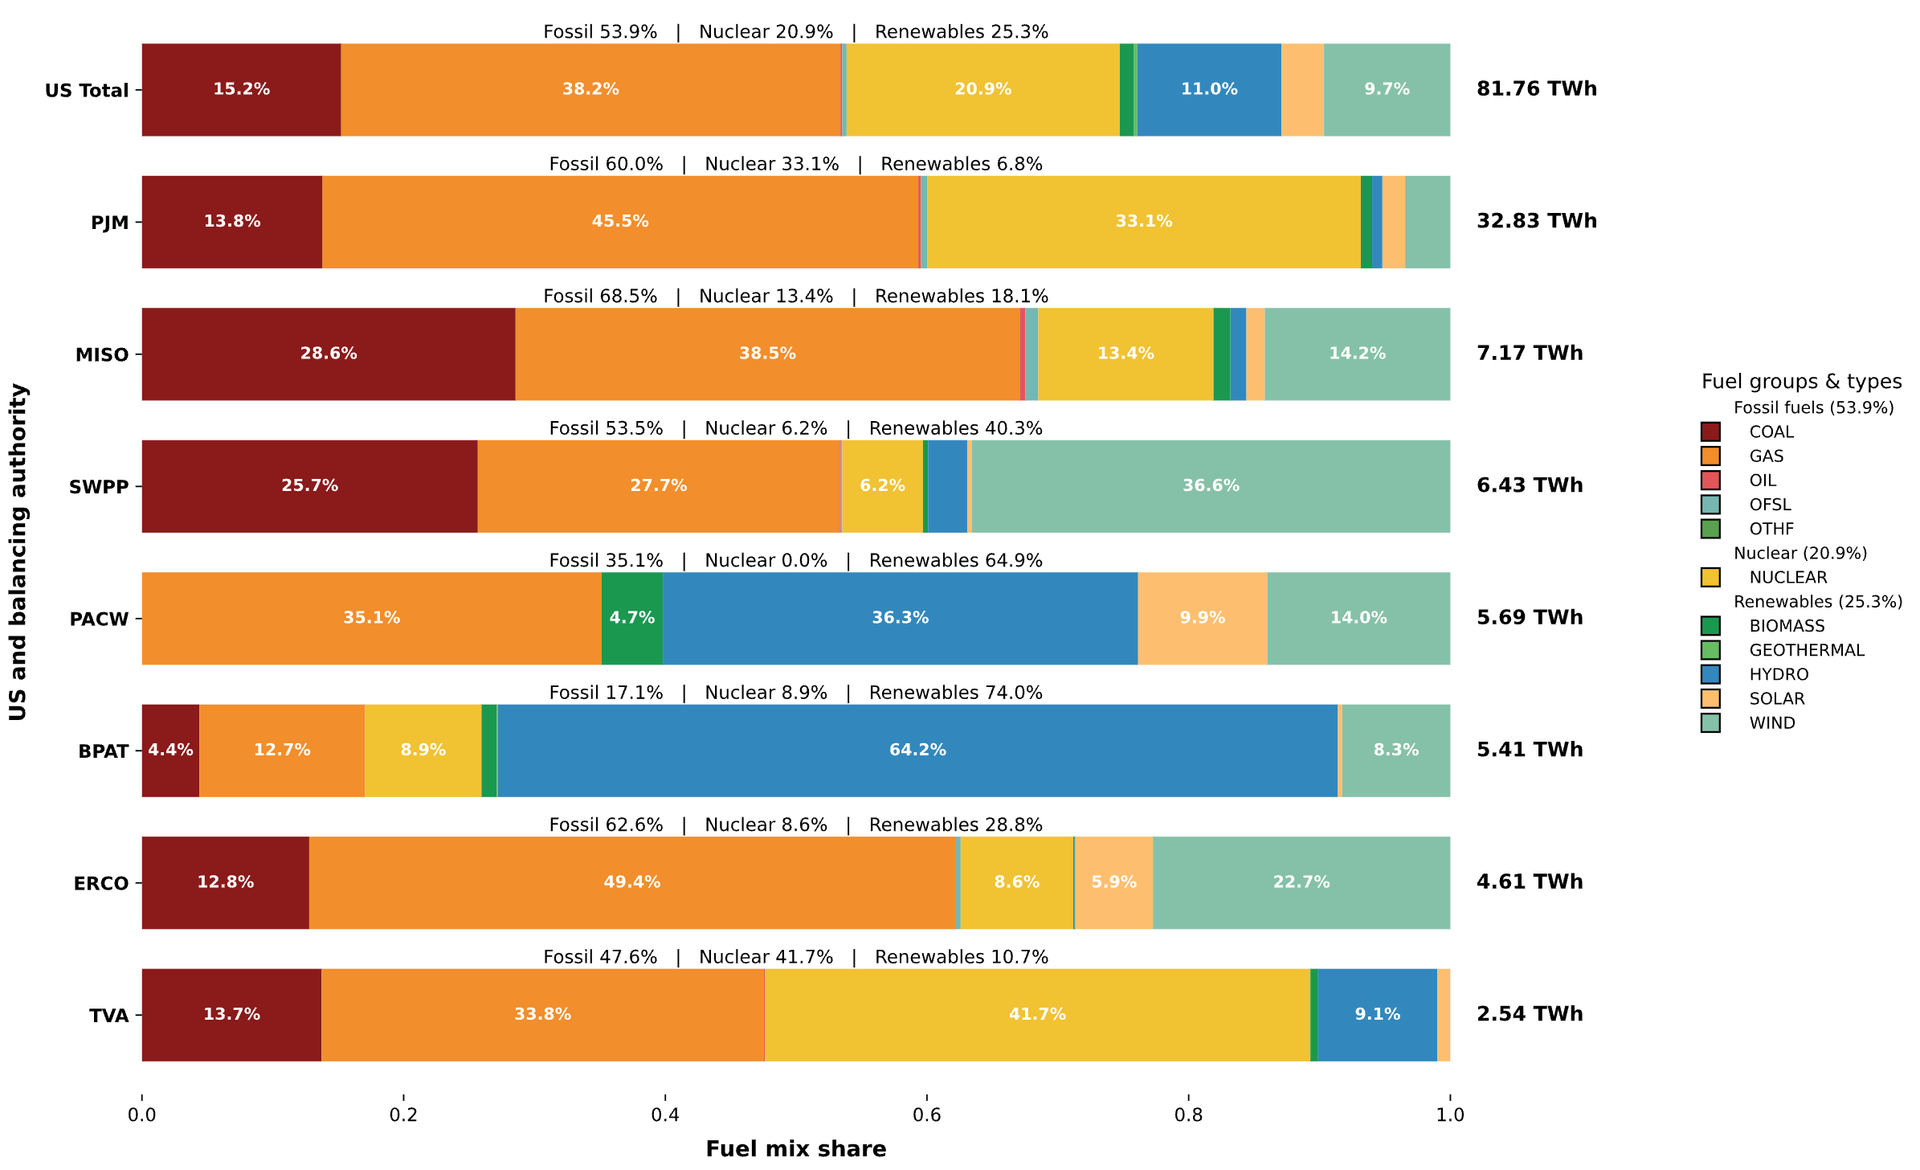
Power consumption concentrated heavily in specific regions. Virginia alone hosted 142 of the 403 sites, accounting for 21.4 TWh, roughly a quarter of the total. PJM, the grid operator serving 13 states including Virginia plus Washington D.C., covers America's largest grid region and accounted for 32.8 TWh, or approximately 40% of all hyperscale data center consumption. Virginia's power draw nearly matched the 22.85 TWh estimate for all U.S. hyperscale sites from 2018.
Energy Sources and Carbon Intensity
Fossil fuels supplied 53.9% of the estimated electricity draw, with natural gas accounting for 38.2% and coal for 15.2%. Renewables provided 25.3% of power, while nuclear made up the remaining 20.9%. These figures translate to a CO2 output range of 21–31 Mt, compared with the 10.5 Mt estimated in 2018.
The carbon intensity of hyperscale data center electricity proved lower than the national average, at 314 g of CO2 per kWh versus 348 g for the entire U.S. grid—roughly 10% cleaner. This advantage stems partly from the concentration of large loads in PJM territory, which relies heavily on nuclear power, and in Oregon, which draws substantial hydroelectric generation. However, nearly a quarter of the load sits in regions with dirtier-than-average grids. The study's calculations used 2023 plant data but did not track which specific plants supply individual sites, and excluded clean-power contracts and renewable energy credits.
Study Limitations and Future Measurement
The research window closed in April 2025, yet the footprint has likely expanded significantly since. "The footprint could already be substantially larger now in 2026," according to lead author Gianluca Guidi. The median site capacity in the study appears modest compared to planned facilities, many of which will span hundreds or thousands of megawatts. On-site power generation, such as gas plants, may escape detection in grid data.
Official measurement may arrive soon. The Energy Information Administration completed pilot surveys of data center energy use and is designing a broader sector survey based on those results, a spokesperson told Wired. The initial pilots, launched in March, used web surveys and in-person interviews to gather information from 196 companies about energy sources, electricity consumption, servers and cooling systems, though coverage did not extend to all states. Francesca Dominici, the study's corresponding author, identified quantifying health effects as the next priority in understanding data centers' direct human impact.