Docker's Observability Challenge: Why Tracing Tools Matter for Distributed Systems
As containerized microservices architectures grow more complex, developers struggle to diagnose performance issues across interconnected services. OpenTelemetry and Jaeger offer the visibility needed to troubleshoot problems faster and reduce downtime.

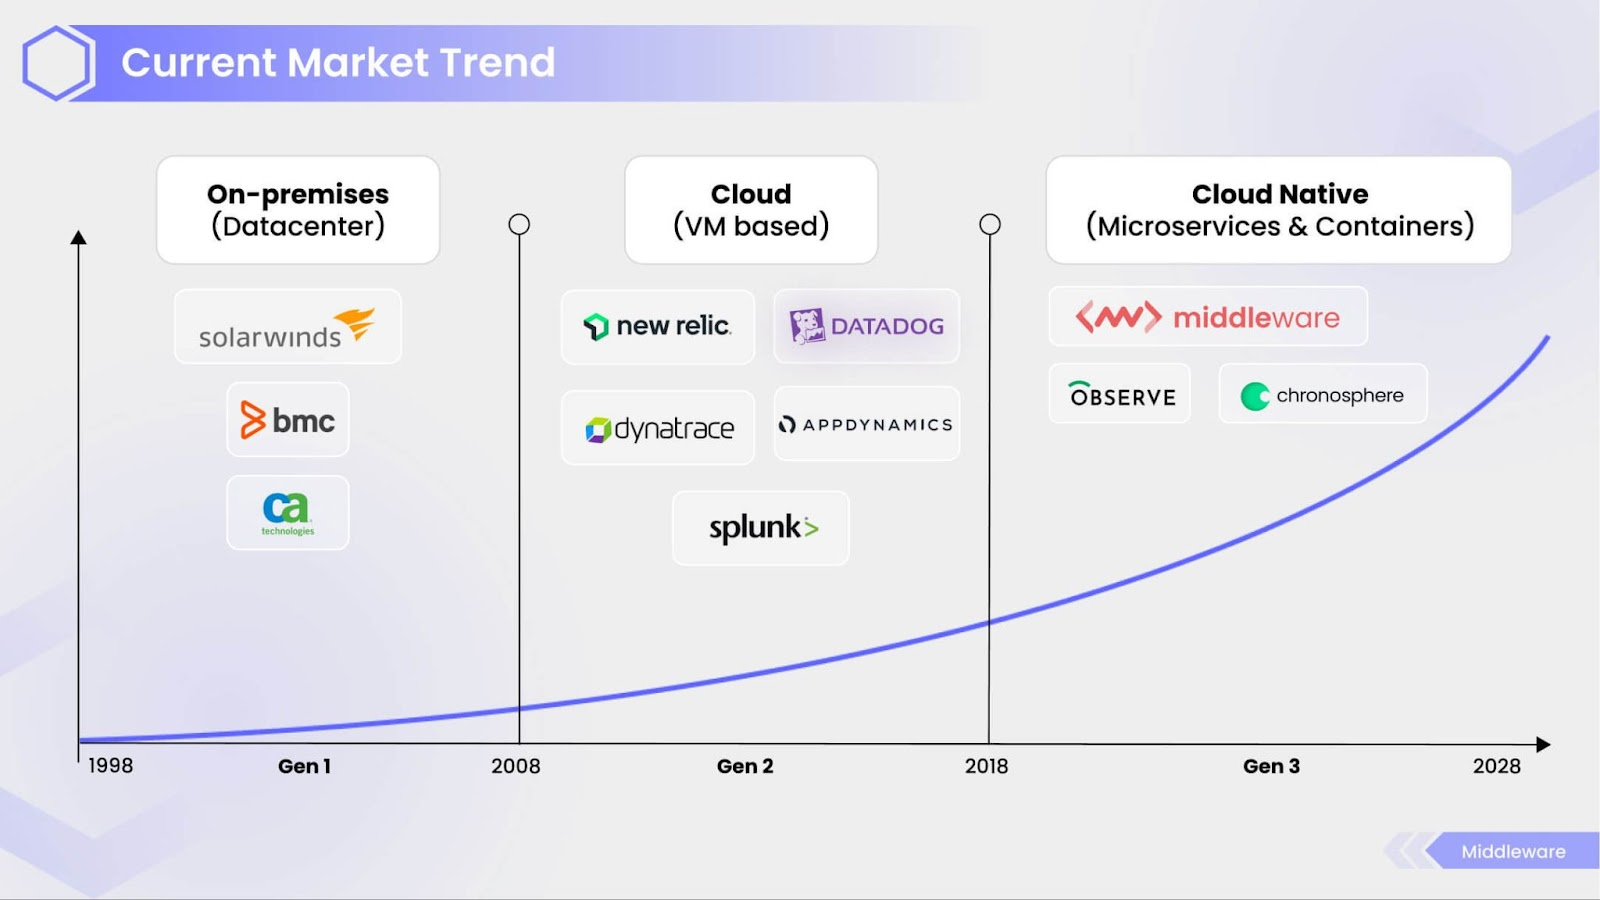
The shift toward distributed systems built on containers, microservices, and cloud-native technologies has made software delivery faster but introduced new debugging headaches. When applications span multiple interdependent services, pinpointing the source of errors or performance bottlenecks becomes exponentially harder. Traditional monitoring and log analysis fall short when you need real-time visibility into how requests flow through your system. End-to-end observability—going beyond basic metrics and logs to trace requests across service boundaries—has become essential for maintaining reliability and reducing Mean Time To Resolution (MTTR).
Why Observability Matters More Than Ever
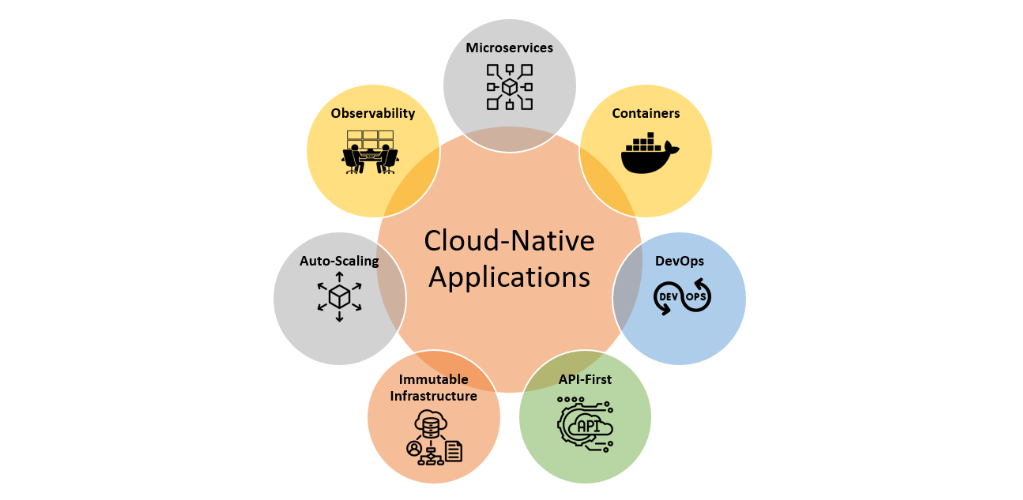
Modern applications built as distributed systems face three critical observability challenges. First, pinpointing errors or bottlenecks within many interconnected microservices requires visibility that traditional tools cannot provide. Second, detecting slow responses or resource contention demands real-time insights rather than time-lagged logs or alerts. Third, teams need immediate visibility into system performance rather than relying on historical data.
Without comprehensive observability, troubleshooting becomes slow and expensive. In practice, teams working with container infrastructure at scale have found that relying solely on log correlation and alert-driven metrics succeeds only about 70% of the time—the rest involves guesswork and lengthy incident response meetings. Adding distributed tracing to the mix transforms the process: MTTR drops significantly, and debugging shifts from sifting through logs to following request timelines across services.
Why Docker-Based Environments Need Observability
Docker's ability to simplify deployment, ensure consistency, and enable easy scaling has transformed software operations. Yet containers introduce their own observability obstacles. Containers start and stop frequently, making traditional monitoring harder. They share resources in ways that can mask performance issues. Microservices often communicate asynchronously, obscuring the flow of requests and making tracing difficult without proper instrumentation.
Consider a real scenario: an application running in containers kept crashing intermittently. CPU and memory metrics looked normal. Logs provided no useful clues. Autoscaling hid the symptoms. Only when trace context was added using OpenTelemetry and visualized in Jaeger did the root cause become clear—an authentication service timing out under high concurrent traffic downstream. Metrics alone could never have revealed this dependency issue. Deploying observability solutions in Docker environments gives developers and operators the detailed insights needed to understand what is actually happening inside running containers.
Introducing OpenTelemetry and Jaeger
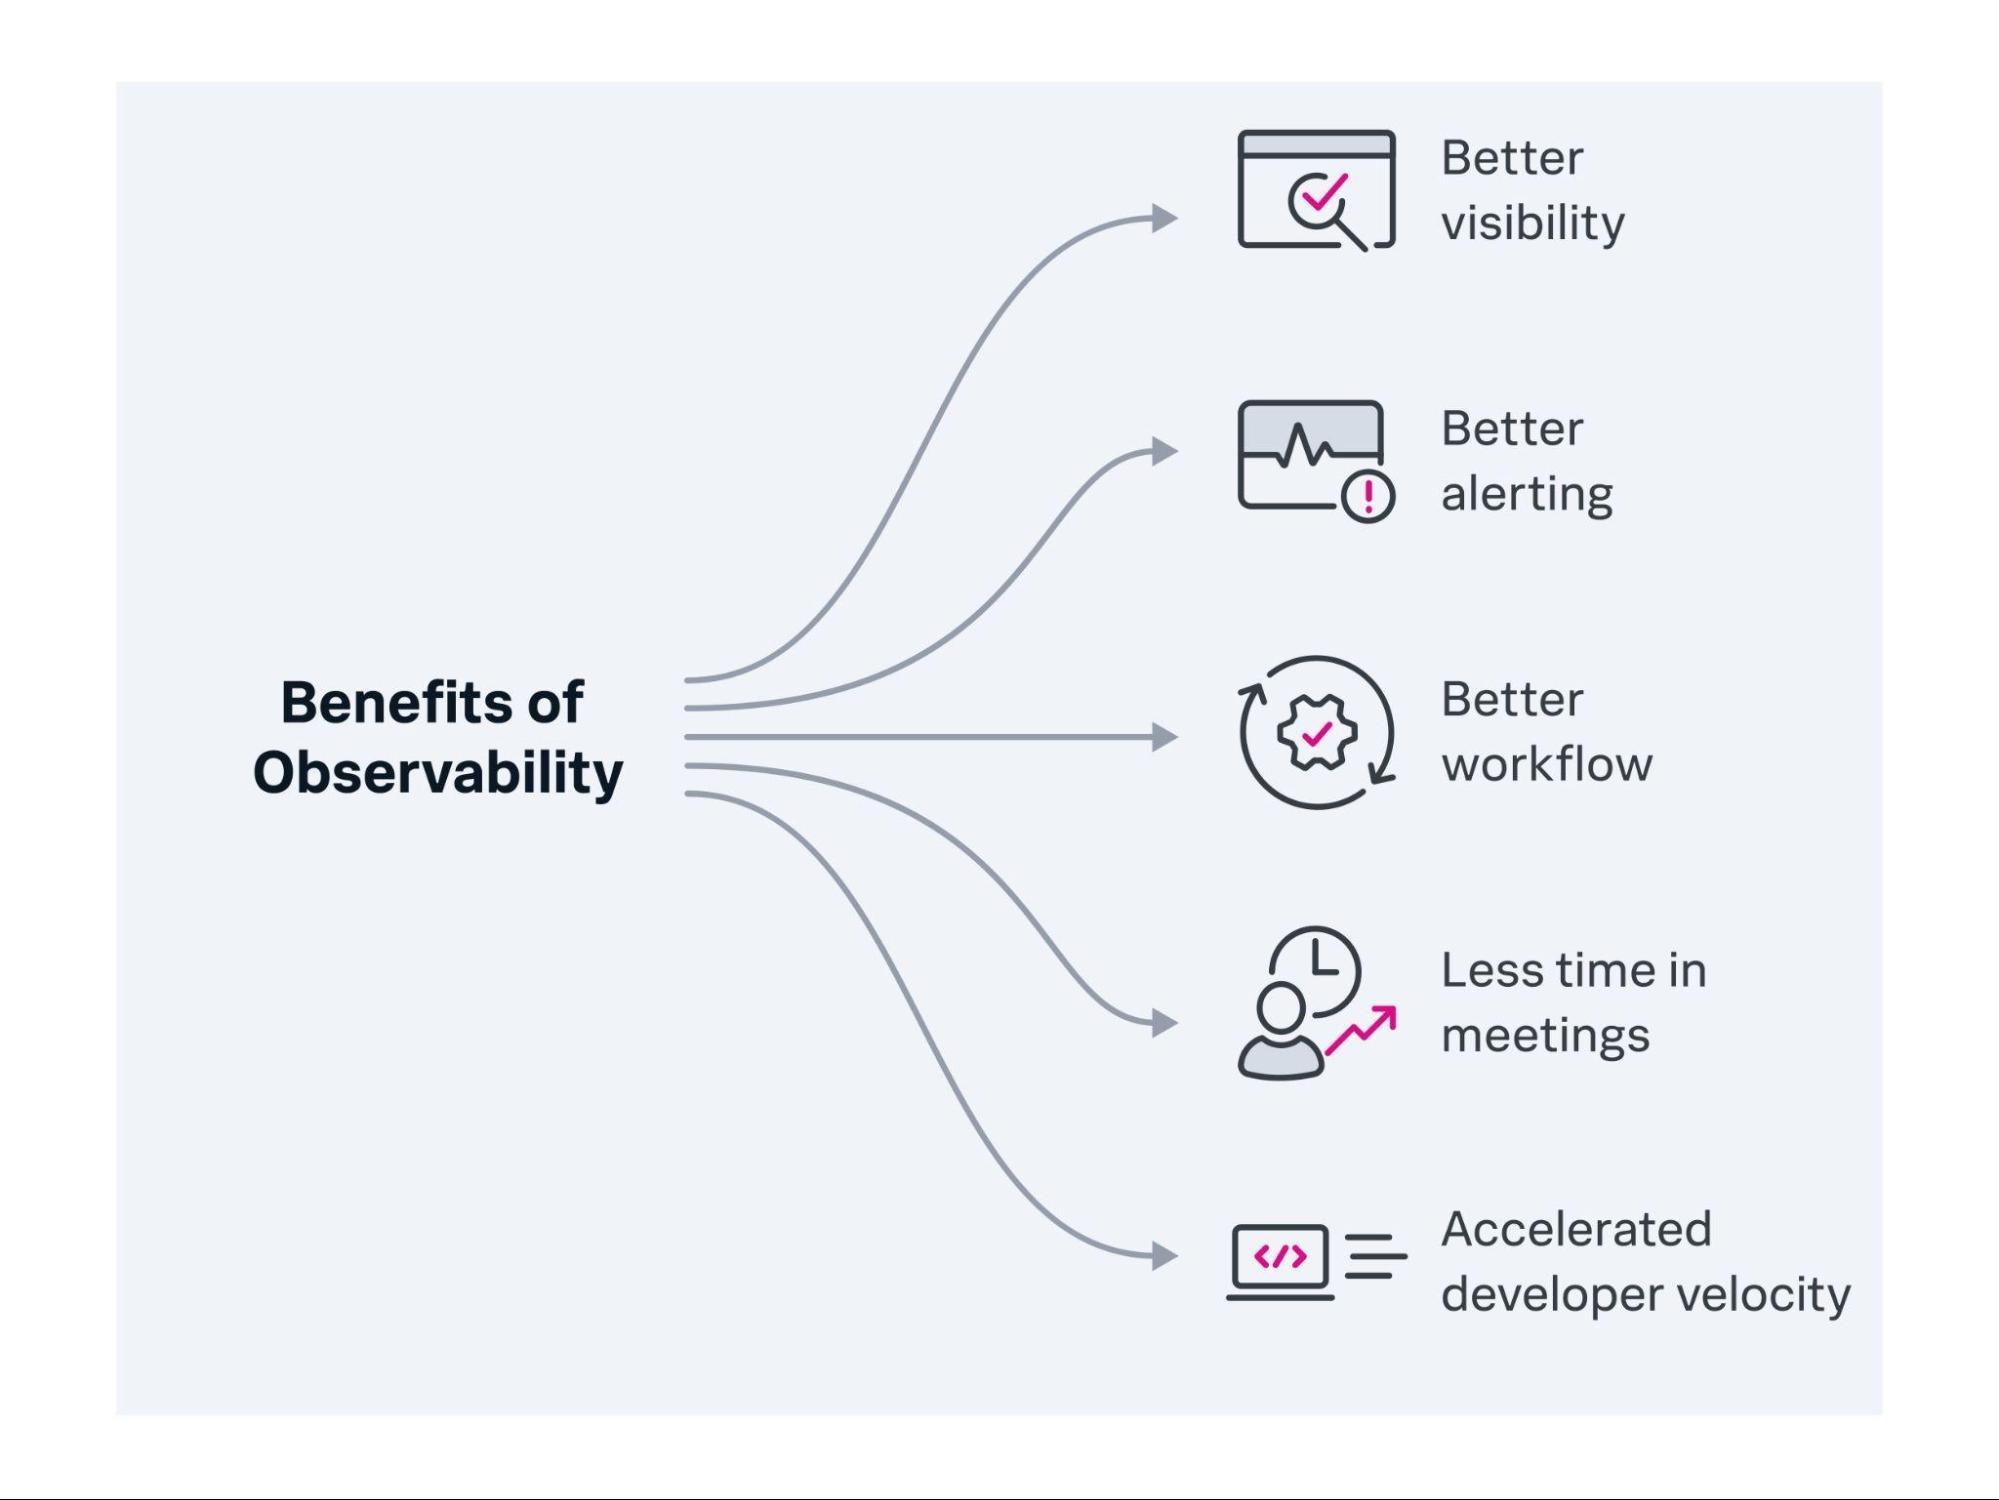
OpenTelemetry
OpenTelemetry is an open CNCF standard for instrumentation, tracing, and metrics collection in cloud-native applications. It provides a consistent way to collect telemetry data across your applications, making observability easier to implement and data analysis simpler.
Jaeger
Jaeger is an open-source distributed tracing system originally developed by Uber. It excels at visualizing and analyzing trace data from OpenTelemetry, offering practical dashboards that help developers quickly identify performance bottlenecks and issues.
Alternative Solutions to Jaeger
While Jaeger is a powerful option, other tracing tools exist depending on your specific needs:
- Zipkin provides similar features and is OpenTelemetry compliant.
- Elastic APM offers a full observability platform with native support for tracing, metrics, and logging.
- Datadog and New Relic are proprietary solutions with deep observability capabilities.
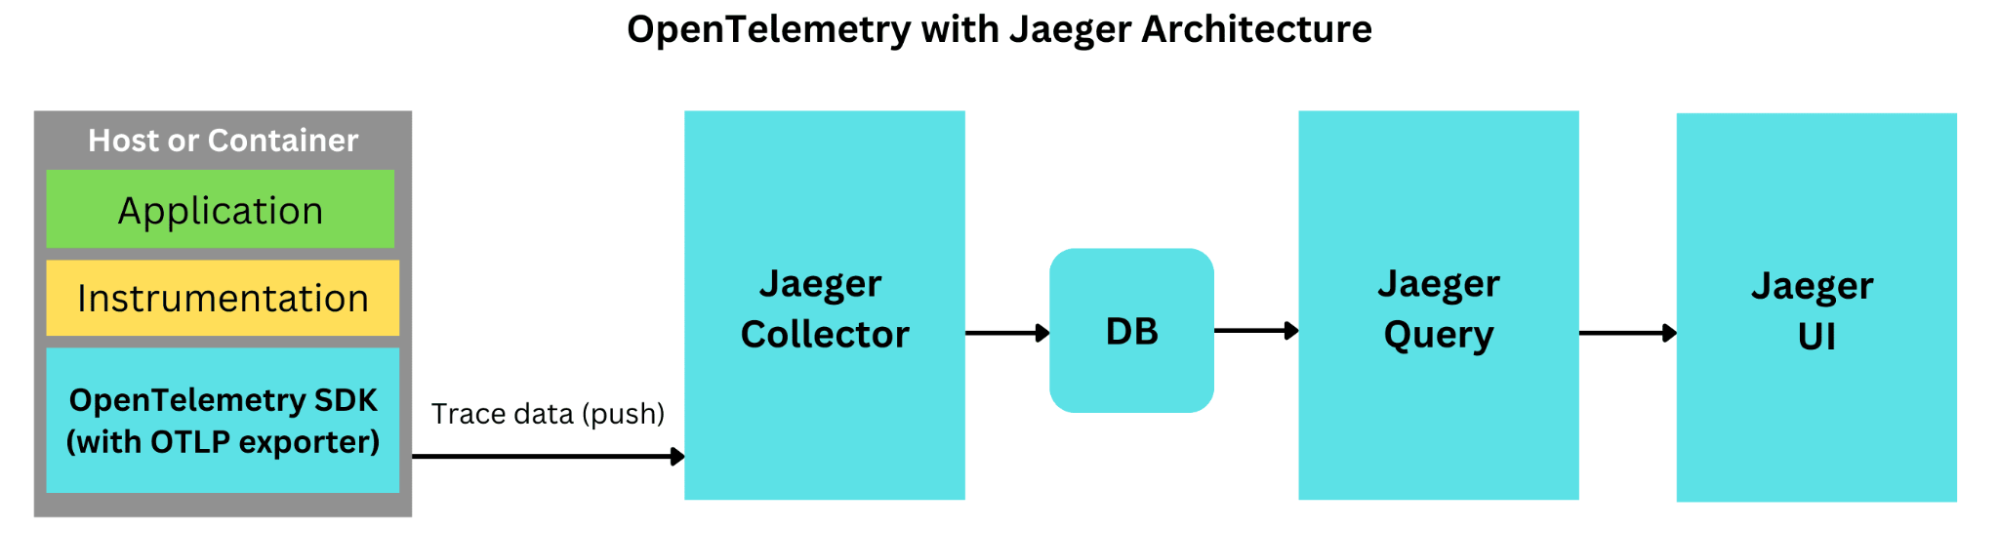
Jaeger stands out for teams seeking an affordable and flexible solution, thanks to its open-source nature and seamless integration with Docker environments.
Setting Up OpenTelemetry and Jaeger in Docker
Step 1: Instrument Your Application
Here is how to instrument a Node.js microservice with OpenTelemetry and Jaeger:
// server.js
const express = require('express');
const { NodeTracerProvider } = require('@opentelemetry/sdk-node');
const { registerInstrumentations } = require('@opentelemetry/instrumentation');
const { ExpressInstrumentation } = require('@opentelemetry/instrumentation-express');
const { JaegerExporter } = require('@opentelemetry/exporter-jaeger');

const provider = new NodeTracerProvider();
provider.addSpanProcessor(
  new (require('@opentelemetry/sdk-trace-base').SimpleSpanProcessor)(
    new JaegerExporter({ endpoint: 'http://jaeger:14268/api/traces' })
  )
);

provider.register();
registerInstrumentations({ instrumentations: [new ExpressInstrumentation()] });

const app = express();
app.get('/', (req, res) => res.send('Hello World'));
app.listen(3000);
FROM node:18-alpine
WORKDIR /app
COPY package.json ./
RUN npm install
COPY . .
EXPOSE 3000
CMD ["node", "server.js"]
version: '3.8'
services:
  app:
    build: .
    ports:
      - "3000:3000"
    depends_on:
      - jaeger
  jaeger:
    image: jaegertracing/all-in-one:1.55
    ports:
      - "16686:16686"
      - "14268:14268"
Launch your environment with docker compose up. Access the Jaeger UI at http://localhost:16686 to explore tracing data.
Real Experience Implementing This at Scale
Deploying this configuration across many microservices in a high-traffic production system reveals a critical lesson: observability must be built in from the start, not added as an afterthought. When container orchestration provides scalability and traces provide visibility into the system, all teams—infrastructure, frontend, backend—can use the same trace IDs to solve edge cases. This unified approach was impossible with disconnected logging systems.
Practical Use Cases and Industry Examples
Major technology companies including Uber, Red Hat, and Shopify rely on Jaeger for real-time observability. These organizations use distributed tracing to quickly detect microservice performance degradation, improve end-user experience by proactively identifying latency problems, and ensure high reliability through timely incident detection and resolution.
Advanced Observability Techniques
Distributed Context Propagation
Use OpenTelemetry's automatic HTTP header propagation to maintain trace context as requests move between services.
Custom Span Creation
For deeper understanding of complex functions, manually define spans:
const axios = require('axios');
app.get('/fetch', async (req, res) => {
  const result = await axios.get('http://service-b/api');
  res.send(result.data);
});
const { trace } = require('@opentelemetry/api');
app.get('/compute', (req, res) => {
  const span = trace.getTracer('compute-task').startSpan('heavy-computation');
  // Compute-intensive task
  span.end();
  res.send('Done');
});
Integrating Observability into CI/CD Pipelines
Observability checks should be part of continuous integration and deployment workflows, such as GitHub Actions, to ensure code changes meet visibility requirements:
name: CI Observability Check
on: [push]
jobs:
  check:
    runs-on: ubuntu-latest
    steps:
      - uses: actions/checkout@v2
      - name: Run Docker Compose
        run: docker compose up -d
      - name: Observability Verification
        run: curl --retry 5 --retry-delay 10 --retry-connrefused http://localhost:16686
The Future of Observability
Observability technology is advancing rapidly, particularly with AI-driven analytics and predictive monitoring. Emerging capabilities include automated anomaly detection, AI-assisted root cause analysis, and improved predictive alerting that enables early incident prevention.
OpenTelemetry and Jaeger position organizations to leverage these improvements in future deployments. As teams increasingly deploy AI and machine learning services, observability must evolve accordingly. Experience integrating LLM services into container pipelines demonstrates how opaque model behavior can become. OpenTelemetry and similar technologies are beginning to address this gap, and the ability to see inference latency and system interactions on a unified timeline will be crucial in an AI-native world.
Conclusion
Combining OpenTelemetry and Jaeger significantly enhances observability in Docker environments, enabling teams to monitor and govern distributed systems more effectively. Together, these technologies deliver real-time, actionable intelligence that enables faster troubleshooting, improves performance, and maintains high availability. As containerization and microservices adoption accelerates, mastering observability best practices has become essential for operational success.
Source: The New Stack